
Our own Moving Images Moving Landscape Report, published last month, explores all aspects of the moving image business in Australia. We aim to cover everything – from advertising to streaming TV; from video asset management to content regulation. Sometimes it’s hard to go into much depth. So we decided to take a look at some of our key findings and put them in the context of other relevant research.
We’ve picked one finding from each of:
- marketing and advertising
- film and TV production
- media asset management
then explored in more detail, with links to some of the latest resources and statistics to give a fuller picture.
Enjoy!
Vertical Video

What the Moving Images Moving Landscape Survey 2019 found out:
30% of advertisers and 36% of suppliers have experimented with vertical video.
What the industry says:
Vertical video is driven by mobile viewing – but did you realise quite how much video is watched on mobile? Here’s what SocialChain have to say:
Today, 96% of online video consumption is on mobile, and cries for users to turn their phone 90 degrees and watch in widescreen are increasingly met by resentment of having to do so. Despite it breaking almost every single rule of traditional video, the ergonomics of how we hold our phones has meant that vertical is now the more convenient option for the user. And in today’s world, convenience is the only metric that matters.
Leave it to social marketing company Buffer to publish the ultimate case study. They spent $6000 testing vertical video against traditional video. Here’s a summary:
If we were to boil down this research to one key point, it would be that businesses and brands must keep up with mobile-centric video trends if they want to succeed on social media in 2019. A mobile-centric strategy relies heavily on vertical video and creating content that feels native to each platform.
Interested? Read the full article on Buffer’s vertical video testing.
Keeping Content Safe

What the Moving Images Moving Landscape Survey 2019 found out:
43% have lost content at least once. Even worse, 17% couldn’t get their content back.
What the industry says:
It’s difficult to get statistics on the loss of content specifically. (That’s one reason we conduct the Moving Images Survey!) Here’s what cio.com.au said in 2018 about data loss in general:
Most people store their data on hard drives. Hard drives fail every day for a variety of reasons. While some failures occur simply because the hardware becomes worn out, others fail prematurely due to external factors like overheating, water or fire damage, exposure to magnetic fields, impact due to being dropped. There are also internal factors that can cause a failure like software or file corruption. In the US alone, 140,000 hard drives crash each and every week. About 60% of hard drive failures occur due to a mechanical failure, while the other 40% are a result of misuse. Simple drive recovery can cost upwards of $7,500 and success is not guaranteed.
You might also like this long (but interesting) read on the fire at Universal Studios in June 2008. Universal Music Group’s main archive of masters went up in flames. Although the public position was ‘there was little lost from UMG’s vault‘, internal and legal documents tell a different story.
“The West Coast Vault perished, in its entirety. Lost in the fire was, undoubtedly, a huge musical heritage.”
The Rise of Streaming Services

What the Moving Images Moving Landscape Survey 2019 found out:
Local film and TV producers overwhelmingly support local content quotas for the streaming giants.
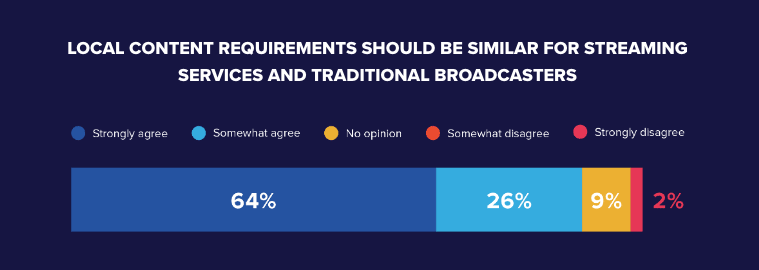
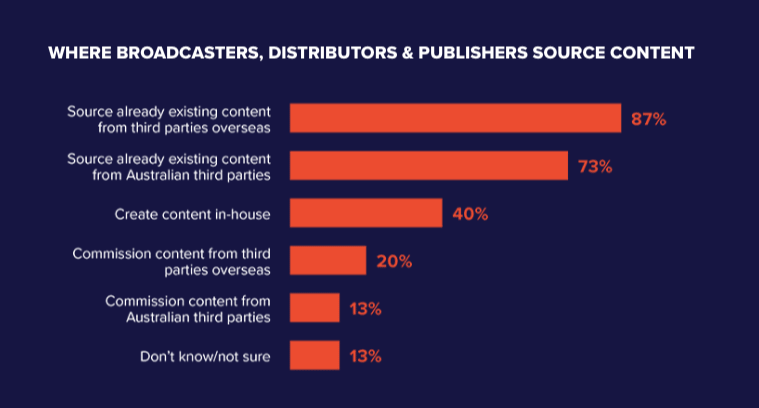
Meanwhile, broadcasters, publishers and distributors don’t prioritise commissioning local content.
What the industry says:
First, it’s clear that subscription TV is here to stay. AMPD Research report that
The average subscribing household pays A$35.30 per month for 1.9 SVOD services, with the average viewer watching almost 10 hours per week of TV series and movies alone.
PWC are predicting 13.7% compound annual growth for the sector.
Concerns about local content seem well founded too. Research by RMIT in 2018 found that:
- The Australian Netflix catalog features 82 Australian titles, which equates to 1.6% of the total catalog.
- Stan features 172 Australian titles, which amount to 11.1% of the catalog.
- For both services, much of the content has been licensed from the ABC. Almost 60% of Netflix Australia’s local television content is ABC content.
But there is one glimmer of hope for producers. It’s hidden in the strategic takeouts from the PWC Media and Entertainment Outlook’s analysis of streamed services:
With the democratisation of distribution platforms, the power and influence of production companies is growing.